
It’s a rare occasion that your Linux data center servers will go rogue on you. It does, however, happen. Why? Because nothing is perfect, and when a machine is connected to a network, you never know when something could go awry. When that frightening inevitability does occur, you’ll be glad to know you have all the tools necessary to resolve the issue.
Any admin worth their weight in bitcoin will start by turning to is logs. Within those wondrous words you will find the keys to many a misbehaving kingdom. For most services (Apache, MySQL, etc.) there are individual logs that can key you into connection, authentication, security, and many more issues. But what happens when the system you need to look into is the server platform itself? When there are hardware issues, what log file do you check?
The first place I look is a special command that offers a host of information about various device drivers that are loaded during boot. The information presented via this command can go a long way toward helping you understand what’s going on with your Linux system. That command is dmesg. I’ve been using this tool to troubleshoot Linux servers and desktops for decades. It’s time you start making use of this handy command. Let’s see how it works.
SEE: IT pro’s guide to working smarter with Linux (Tech Pro Research)
Installation
You’re in luck. dmesg is one of those commands found on every Linux distribution, so there is nothing to install here. You simply have to open up a terminal window and begin using the tool.
Usage
From the bash prompt, issue the command dmesg. You should see a metaphorical ton of information zipping past your eyes. In fact, there is so much information whizzing by so quickly that using the command in this fashion won’t do. With that in mind, how do you work with dmesg? There are a couple of ways. The first way is to pipe the output of dmesg to either less or more, like so:
dmesg | less
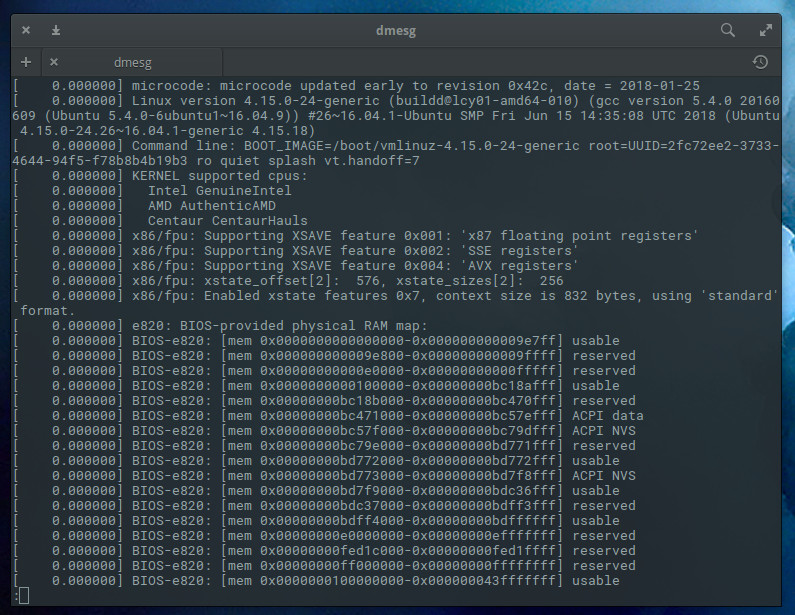
Running dmesg this way allows you to scroll through the output (Figure A).
Figure A

The dmesg command, as viewed through the lens of less.
However, even using dmesg this way isn’t optimal because there’s still that metaphorical ton of information to sift through. Fortunately, dmesg has a few options that allow you to scale back that information. You can limit output to only errors and warnings so you don’t have to sift through everything that’s going right in your system. How do you do this? With the help of the —level flag. There are eight levels that can be viewed, each of which can be combined to make a specific iteration of the dmesg output. The levels are:
- emerg – system is unusable
- alert – action must be taken immediately
- crit – critical conditions
- err – error conditions
- warn – warning conditions
- notice – normal but significant condition
- info – informational
- debug – debug-level messages
Let’s say you want to view only the alert and critical warnings. The command for this would be:
dmesg --level=alert,crit
Hopefully, after running the above command, you’ll see no output. If you see nothing, and you know there’s an issue, drop the level down a notch to, say, errors and warnings:
dmesg --level=err,warn
Now we’re talking usable information (Figure B).
Figure B
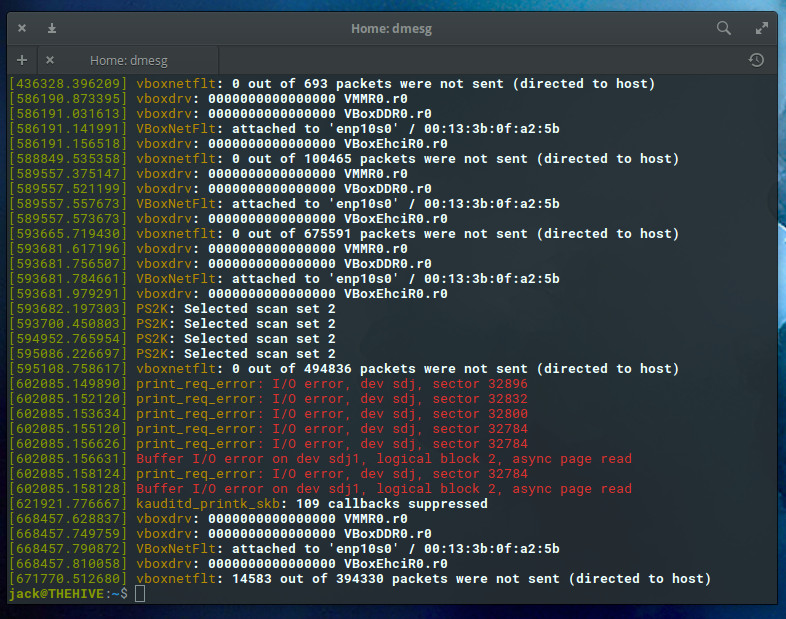
Using the —level flag we can get more specific on what dmesg shows us.
SEE: How to find files in Linux with grep: 10 examples (free TechRepublic PDF)
Timestamps
But wait—dmesg has another handy trick up its sleeve. What if you want to know precisely what time an error or warning occurred? Fortunately, you can add the -T option like so:
dmesg --level=err,warn -T
Now we have a timestamp associated with each entry (Figure C).
Figure C
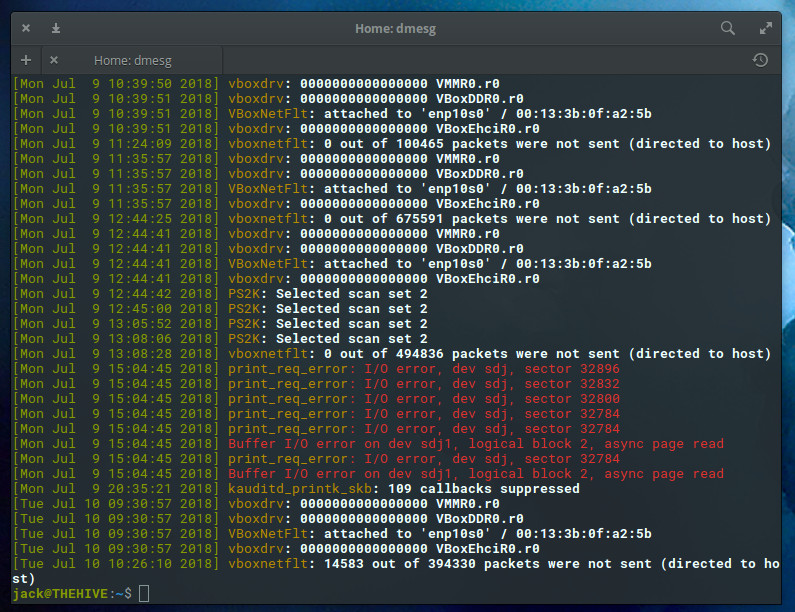
Things are starting to look so much more useful.
If you find there’s still too much information, pipe the above command to less and you can scroll through the output with ease. If you don’t have time to go through all the output at that particular moment, send it to a file for later reading, like so:
dmesg --level=err,warn -T > dmesg_output
You can then view the output of that file any time.
dmesg is your friend
Trust me on this: You want to want to have the dmesg command in your data center admin toolkit. With this easy-to-use tool, you can begin troubleshooting your servers on a broad scale and then start narrowing down your search.
Also read…
Other tools?
What are your go-to commands for diagnosing Linux server issues? Share your advice with fellow TechRepublic members.